PENTA NEWS
PENTA NEWS
Everyday math: statistics for estimating participation during demonstrations
Interview to Llorenç Badiella, head of the UAB Applied Statistics Facility. Llorenç’s motto is: “statistics requires a sceptical vision of the world.” He studies how to count crowd in demonstrations with statistical methods.
Llorenç is busy counting crowds in demonstrations. And much more.
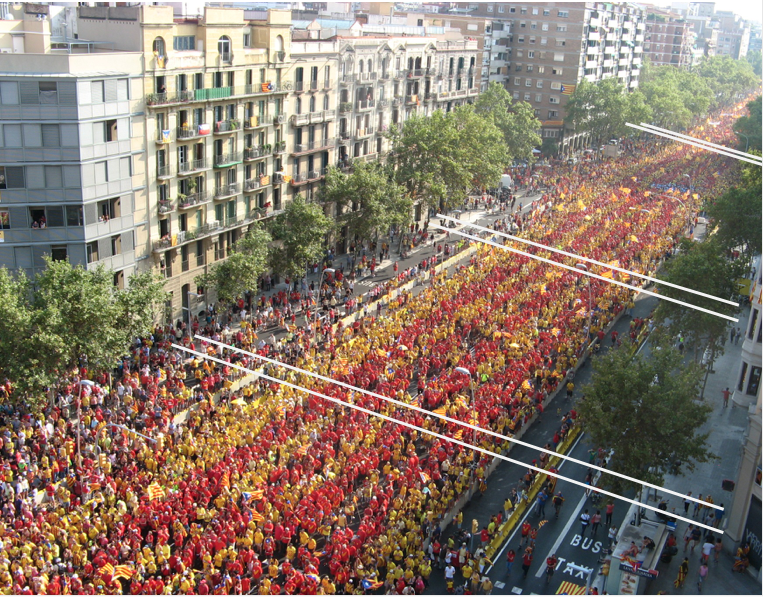
Slices in a Diada demonstration
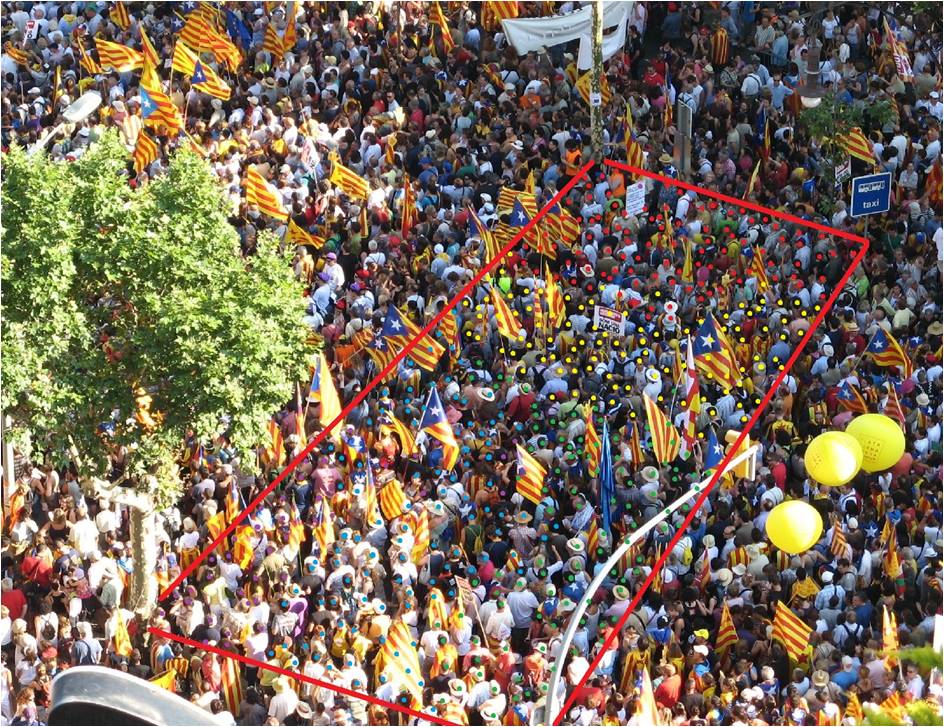
How many heads do you see in this rectangle?
Catalonia has witnessed a significant number of demonstrations in past few months. At BGSMath, we like to attach numbers to things and no one is better at it over here than Llorenç Badiella, head of the Applied Statistics Facility of the UAB, called SEA. His team’s job is to provide methodological support to UAB researchers, pharmaceutical labs, hospitals, banks, NGOs, and public entities. Llorenç’s favourite motto is: “statistics requires a sceptical vision of the world.”
What do statisticians feel when they read estimates for attendance at a demonstration?
Disappointment. There are many quantitative tools we can use for these estimates. I perceive there’s a need and a growing interest in the media for statistics, but it is embittering to notice the lack of will to make an objective use of these available tools. In political demonstrations, it’s always very hard to dismantle well-established narratives by being sceptical. Furthermore, it takes a couple of days to give a realistic estimate. This is usually too late for news and political commentators.
What is the approach for getting a reliable estimate of participants?
I defend statistics as a way to get closer to reality. The simple approach is just to count. In practice, it can be done with an aerial picture that you later process with a computer program that calibrates it and comes out with an estimation. You use the same approach to count stars in an astronomical picture or trees in a field, for example.
Which characteristics should the picture have?
The most important one is that it has to cover all the area that you want to count. Then, via a specific algorithm, you can individually count “points”, “heads”, or whatever you need to count. You detect the “points” through a colour gradient or via texture, that is, calibrating a pixeled area with specific densities. These are very rigorous techniques, they are employed for example to determine pilgrims’ concentrations during the Hajj rituals to Mecca, and they are strongly needed to plan for big concentrations of people.
What typical concentrations of people can one find?
There’s an extensive literature on the density issue, on when a specific density begins to be dangerous, on what is the flux of a crowd depending on the concentration, etc. The maximum density you can observe is 6 people per square metre. This means a very, very tight steady concentration. If a demonstration is moving, for this to be possible, the density has to drop to around one person per square metre. These values are known since the Sixties.
So, the two key factors are area and density.
We need to be careful. What counts is the average density. It can occasionally be even 6 people per square metre, but that does not mean this is the average value. Sometimes one considers a very generous area: this makes the average much lower. Also, you need to consider in the areas all the elements that cannot be occupied: kiosks, benches, etc. Furthermore, in Barcelona, the intersections of many big street have a much wider area. In my experience, dense crowd demonstrations can reach an average density of around 3 people per metre square. However, figures provided by official organisers are often inconsistent or nonsensical.
What do you mean?
That sometimes the numbers that are given imply concentrations of 10 people per square metre. One typical example is Passeig de Gràcia in Barcelona, which measures around 75,000 square metres from top to bottom. In some recent and historical demonstrations, organisers talked of a million people. If you make the calculations, you will see that this makes absolutely no sense.
Sometimes, though, demonstrations go much beyond the planned area.
True. This is why you need a very good field work and arial pictures if you want to come out with reliable numbers. It takes some time to give solid estimates.
Are there other methods?
With experience – I have been counting demonstrations since 2006 – we have come out with a different approach to make the calculations, that makes use of the logistics of the demonstrations themselves. As an example, I’ll take the 11-September rallies, the Catalan national day. Lately, they have been carefully planned. Organisers had people occupy a well-defined area, and managed participants to distribute themselves homogenously. The method we applied was to select a set of 25 “slices” where we made physical on-the-field counting, from side to side. Some of the sampled slices were taken at the intersections, where people spilled out of the pre-set areas. We obtained figures between 50 and 250 people per slide. When we integrate all of the info, we calibrate the result considering also those samples where we could not conclude the counting due to a punctual extreme density.
Do your calculations in general correspond to the official counting?
Public officers do not explain their methods. This is what triggered our motivation to provide alternative counting. What I have been observing lately is that on a general basis, the Guàrdia Urbana (Barcelona municipal police) seems to use systematically an average density of 4, whereas other entities seem less systematic in their calculation. As mentioned, our estimates for dense crowds oscillated between 2.5 and 3 people per square metre.
What’s the take-home message? Should we trust statistics?
When someone says that with statistics you may lie, I respond that without statistics, lies can be bigger. Statistics measures uncertainty. People should always distrust figures that are too precise.
Participants